性能优化技巧
- 使用Functional components
- 局部变量,
computed内不通过this获取data而是通过参数解构,因为watcher获取value是执行this.getter.call(vm, vm),其实是在前面提取data或者props中的数据,而不是一次一次的使用this.去访问,这样就只走一个getter的响应式收集。 - 用
v-show指令替代了v-if指令来替代组件的显隐,v-show在patchVnode过程中,内部会对执行v-show指令对应的钩子函数update,然后它会根据v-show指令绑定的值来设置它作用的 DOM 元素的style.display的值控制显隐。 KeepAlive- 延迟渲染,把一个组件的一次渲染拆成多次,按优先级使用
requestAnimationFrame,使用v-if判断是否要渲染 - 使用
Object.freeze()冻结成为非响应式的数据 - 使用
Virtual scrolling虚拟滚动组件 - 使用
requestAnimationFrame时间切片提交响应式数据。
(1)代码层面的优化
- v-if 和 v-show 区分使用场景
- computed 和 watch 区分使用场景
- v-for 遍历必须为 item 添加 key,且避免同时使用 v-if
- functional component
- 长列表性能优化
- 事件的销毁
- 图片资源懒加载
- 路由懒加载
- 第三方插件的按需引入
- 优化无限列表性能
- 服务端渲染 SSR or 预渲染
(2)Webpack 层面的优化
- Webpack 对图片进行压缩
- 减少 ES6 转为 ES5 的冗余代码
- 提取公共代码
- 模板预编译
- 提取组件的 CSS
- 优化 SourceMap
- 构建结果输出分析
- Vue 项目的编译优化
(3)基础的 Web 技术的优化
- 开启 gzip 压缩
- 浏览器缓存
- CDN 的使用
- 使用 Chrome Performance 查找性能瓶颈
大文件上传和断点续传
长列表优化
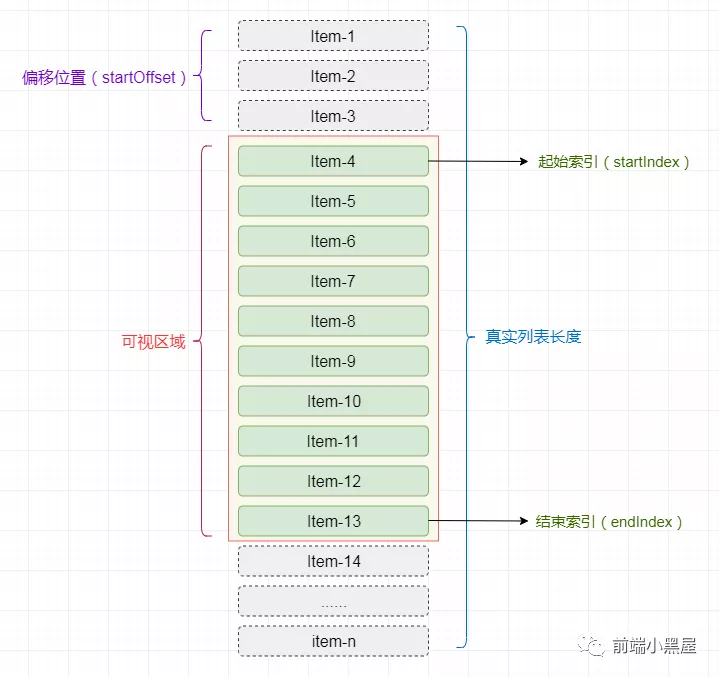
虚拟列表的实现,实际上就是在首屏加载的时候,只加载 可视区域内需要的列表项,当滚动发生时,动态计算获得可视区域内的列表项。
计算当前 可视区域起始数据索引( startIndex)
计算当前 可视区域结束数据索引( endIndex)
计算当前 可视区域的数据,并渲染到页面中
计算 startIndex对应的数据在整个列表中的偏移位置 startOffset并设置到列表上
html
<div class="infinite-list-container">
    <div class="infinite-list-phantom"></div>
    <div class="infinite-list">
      <!-- item-1 -->
      <!-- item-2 -->
      <!-- ...... -->
      <!-- item-n -->
    </div>
</div>- infinite-list-container 为可视区域的容器
- infinite-list-phantom 为容器内的占位,高度为总列表高度,用于形成滚动条
- infinite-list 为列表项的渲染区域
监听infinite-list-container的scroll事件,获取滚动位置scrollTop
列表项动态高度
- 对组件属性props的itemSize进行扩展,支持传递类型为数字、数组、函数
- 可以是一个固定值,如 100,此时列表项是固高的
- 可以是一个包含所有列表项高度的数据,如
[50, 20, 100, 80, ...] - 可以是一个根据列表项索引返回其高度的函数:
(index: number): number
2.将列表项渲染到屏幕外,对其高度进行测量并缓存,然后再将其渲染至可视区域内。
3.以预估高度先行渲染,然后获取真实高度并缓存。
点击查看代码
vue
<template>
 <div
   class="list-view"
   @scroll.passive="handleScrollFn">
   <div
     class="list-view-phantom"
     :style="{
        height: contentHeight
     }">
   </div>
   <div
     ref="content"
     class="list-view-content">
     <div
       class="list-view-item"
       :style="{
         height: itemHeight + 'px'
       }"
       v-for="(item) in visibleData"
       :key="item.id">
       <slot :row="item" :index="data.indexOf(item)">
       </slot>
     </div>
   </div>
 </div>
</template>

<script>
export default {
 name: 'ListView',

 props: {
   data: {
     type: Array,
     required: true
   },

   itemHeight: {
     type: Number,
     default: 30
   },

   itemSizeGetter: {
     type: Function
   }
 },

 data () {
   return {
     visibleData: [],
     handleScroll: () => {}
   }
 },

 computed: {
   contentHeight ({ data, itemHeight }) {
     return data.length * itemHeight + 'px'
   }
 },

 created () {
   this.handleScroll = this.throttle(this.handleScrollFn, 200)
 },

 mounted () {
   this.updateVisibleData()
 },

 methods: {
   updateVisibleData (scrollTop = 0) {
     const visibleCount = Math.ceil(this.$el.clientHeight / this.itemHeight) // 取得可见区域的可见列表项数量
     const start = Math.floor(scrollTop / this.itemHeight) // 取得可见区域的起始数据索引
     const end = start + visibleCount // 取得可见区域的结束数据索引
     this.visibleData = this.data.slice(start, end) // 计算出可见区域对应的数据,让 Vue.js 更新
     this.$refs.content.style.webkitTransform = `translate3d(0, ${start * this.itemHeight}px, 0)` // 把可见区域的 top 设置为起始元素在整个列表中的位置(使用 transform 是为了更好的性能)
   },

   handleScrollFn (e) {
     const scrollTop = this.$el.scrollTop
     this.updateVisibleData(scrollTop)
   },
   throttle (fn, wait) {
     let timer = null
     return function () {
       const args = arguments
       const context = this
       if (timer) return
       timer = setTimeout(() => {
         fn.apply(context, args)
         timer = null
       }, wait)
     }
   }
 }
}
</script>
<style>
 .list-view {
   height: 400px;
   overflow: auto; /* 浏览器知道添加滚动条 */
   position: relative;
   border: 1px solid #aaa;
 }

 .list-view-phantom {
   position: absolute;
   left: 0;
   top: 0;
   right: 0;
   z-index: -1;
 }

 .list-view-content {
   left: 0;
   right: 0;
   top: 0;
   position: absolute;
 }

 .list-view-item {
   padding: 5px;
   color: #666;
   line-height: 30px;
   box-sizing: border-box;
   overflow: hidden;
   text-overflow: ellipsis;
   white-space: nowrap;
 }
</style>
使用
vue
<ListView :data="data">
  <template v-slot:default="{ row, index }">
    <div class="list-item-tr">
      <span>{{ index }}</span>
      <span>{{ row.address }}</span>
      <span>{{ row.level }}</span>
      <span> {{row.time | ftime('s')}}</span>
      <span class="text-tow-ellipsis">{{ row.message || '-' }}</span>
      <a type="text" @click="openDetailDrawer(row)">查看详情</a>
    </div>
  </template>
</ListView>
如何在Vue项目中更优雅地使用svg
svg-sprite-loader 将加载的 svg 图片拼接成 雪碧图,放到页面中,其它地方通过 <use> 复用
重置vue实例的data: Object.assign(this.$data, this.$options.data());
如果需要对data的某个对象的某个属性值做监听,可以通过computed把这个属性值的层级提上来,然后在watch中监听computed里面的属性。
只有被html用到的属性才会去做依赖收集,到时候才会去做更新通知。
Vue实现函数防抖组件
javascript
const debounce = (func, time, ctx) => {
    let timer
    const rtn = (...params) => {
        clearTimeout(timer)
        timer = setTimeout(() => {
            func.apply(ctx, params)
        }, time)
    }
    return rtn
}
// 抽象组件
Vue.component('Debounce', {
    abstract: true,
    props: ['time', 'events'],
    created () {
      this.eventKeys = this.events.split(',')
      this.debouncedMap = {}
    },
    render() {
        const vnode = this.$slots.default[0]

        this.eventKeys.forEach((key) => {
            const target = vnode.data.on[key]
            if (this.debouncedMap[key]) {
                vnode.data.on[key] = this.debouncedMap[key]
            } else {
                this.debouncedMap[key] = debounce(target, this.time, vnode)
                vnode.data.on[key] = this.debouncedMap[key]
            }
        })

        return vnode
    },
})
vue
<div id="app">
    <Debounce :time="1000" events="click">
        <button @click="onClick($event, 1)">click+1 {{val}}</button>
    </Debounce>
    <Debounce :time="1000" events="click">
        <button @click="onClick($event, 2)">click+2 {{val}}</button>
    </Debounce>
    <Debounce :time="1000" events="mouseup">
        <button @mouseup="onAdd">click+3 {{val}}</button>
    </Debounce>
    <Debounce :time="1000" events="click">
        <button @mouseup="onAdd">click+3 {{val}}</button>
    </Debounce>
</div>
<script>
  export default {
    data () {
        return {
            val: 0,
        }
    },
    methods: {
        onClick ($ev, val) {
            this.val += val
        },
        onAdd () {
            this.val += 3
        }
    }
  }
</script>
自定义指令实现在文本超长缩略时才显示tooltip;render中添加自定义指令写法
vue
<template>
  <cm-tooltip
    :content="item.fieldName"
    :disabled="!showTooltips.includes(item.fieldId)"
    placement="top-start"
    transfer
    max-width="300"
    theme="dark">
      <span class="field-name" v-addtooltip="item.fieldId">{{ item.fieldName }}</span>
  </cm-tooltip>
</template>
<script>
export default {
  directives: {
    addtooltip: {
      inserted: (el, binding, vnode) => {
        if (el.scrollWidth > el.clientWidth) {
          if (!vnode.context.showTooltips.includes(binding.value)) vnode.context.showTooltips.push(binding.value)
        }
      }
    }
  },
  data () {
    return {
      showTooltips: [],
      columns: [
        {
          title: '操作',
          key: 'action',
          width: 150,
          align: 'center',
          fixed: 'right',
          render: (h, params) => {
            return h('div', [
              h('Button', {
                props: {
                  type: 'text',
                  size: 'small'
                },
                on: {
                  click: () => {
                    this.edit(params.row)
                  }
                },
                directives: [ // render中添加自定义指令写法
                  {
                    name: 'hide-btn'
                  }
                ]
              }, '编辑'),
              h('Button', {
                props: {
                  type: 'text',
                  size: 'small'
                },
                on: {
                  click: () => {
                    this.delete(params.row.id)
                  }
                }
              }, '删除')
            ])
          }
        }
    ]
    }
  }
}
</script>
<style>
 .field-name {
        display: inline-block;
        width: 150px;
        overflow: hidden;
        text-overflow: ellipsis;
        white-space: nowrap;
      }
</style>echart 地图
vue
<template>
  <div class="position">
    <van-tabs
      type="card"
      @click="tabClick"
      v-model="type">
      <van-tab
        title="人员分布"
        name="total"></van-tab>
      <van-tab
        title="疑似分布"
        name="suspected"></van-tab>
      <van-tab
        title="确诊分布"
        name="confirmed"></van-tab>
    </van-tabs>
    <v-chart :options="options"/>
    <Table
      v-if="showTable"
      :thead="thead"
      :tbody="tbody"/>
  </div>
</template>

<script>
import vChart from 'vue-echarts'
import Table from './table'
import { getPositionSt } from '@/common/api'
import 'echarts/lib/chart/map'
import 'echarts/lib/component/tooltip'
import 'echarts/lib/component/legend'
import 'echarts/lib/component/title'
import 'echarts/lib/component/visualMap'
import axios from 'axios'
export default {
  components: {
    Table,
    vChart
  },
  props: {
    showTable: {
      type: Boolean,
      default: false
    }
  },
  data () {
    return {
      type: 'total',
      provinces: ['shanghai', 'hebei', 'shanxi', 'neimenggu', 'liaoning', 'jilin', 'heilongjiang', 'jiangsu', 'zhejiang', 'anhui', 'fujian', 'jiangxi', 'shandong', 'henan', 'hubei', 'hunan', 'guangdong', 'guangxi', 'hainan', 'sichuan', 'guizhou', 'yunnan', 'xizang', 'shanxi1', 'gansu', 'qinghai', 'ningxia', 'xinjiang', 'beijing', 'tianjin', 'chongqing', 'xianggang', 'aomen', 'taiwan'],
      provincesText: ['上海', '河北', '山西', '内蒙古', '辽宁', '吉林', '黑龙江', '江苏', '浙江', '安徽', '福建', '江西', '山东', '河南', '湖北', '湖南', '广东', '广西', '海南', '四川', '贵州', '云南', '西藏', '陕西', '甘肃', '青海', '宁夏', '新疆', '北京', '天津', '重庆', '香港', '澳门', '台湾'],
      statistic: {
        suspected: [], // 疑似分布
        confirmed: [], // 确诊分布
        total: [] // 人员分布
      },
      mapName: ''
    }
  },
  computed: {
    thead () {
      return this.mapName === 'china' ? ['省市', '人员总数', '疑似', '确诊'] : ['市区', '人员总数', '疑似', '确诊']
    },
    options () {
      const pieces = this.type === 'total'
        ? [
            { value: 0, label: '0人', color: '#D9E3FF' },
            { gte: 1, lte: 9, label: '1-9人', color: '#A9C0FF' },
            { gte: 10, lte: 49, label: '10-49人', color: '#7398FE' },
            { gte: 50, lte: 199, label: '50-199人', color: '#4476FF' },
            { gte: 200, label: '200+人', color: '#1F4BCB' }
          ]
        : this.type === 'suspected'
        ? [
            { value: 0, label: '0人', color: '#FDECCA' },
            { gte: 1, lte: 4, label: '1-4人', color: '#EDCA9C' },
            { gte: 5, lte: 9, label: '5-9人', color: '#F0B060' },
            { gte: 10, lte: 19, label: '10-19人', color: '#E58F26' },
            { gte: 20, label: '20+人', color: '#C07519' }
          ]
        : [
            { value: 0, label: '0人', color: '#FABEBE' },
            { gte: 1, lte: 4, label: '1-4人', color: '#FF9E9E' },
            { gte: 5, lte: 9, label: '5-9人', color: '#FD6363' },
            { gte: 10, lte: 19, label: '10-19人', color: '#EE4949' },
            { gte: 20, label: '20+人', color: '#AD0F0F' }
          ]
      return {
        title: {
          show: this.mapName !== 'china',
          text: this.statistic.provinceName,
          textStyle: {
            color: '#333',
            fontSize: 13,
            fontWeight: 300
          },
          top: 10
        },
        tooltip: {
          trigger: 'item',
          formatter (params) {
            if (params.name === '南海诸岛') return '' // 南海诸岛点击不显示item
            return `${params.name}:${params.value || 0}人`
          }
        },
        visualMap: {
          type: 'piecewise',
          itemWidth: 23,
          itemHeight: 8,
          padding: 0,
          bottom: 20,
          left: 0,
          itemGap: 4,
          textStyle: {
            fontSize: 10,
            color: '#999'
          },
          pieces: pieces
        },
        series: [
          {
            type: 'map',
            map: this.mapName,
            zoom: this.mapName === 'china' ? 1.3 : 1.2,
            roam: false,
            z: 0,
            emphasis: {
              label: {
                show: false
              },
              itemStyle: {
                areaColor: this.type === 'total' ? '#3F70FE' : this.type === 'suspected' ? '#FEBB39' : '#FE5E3F'
              }
            },
            itemStyle: {
              borderColor: '#FFF',
              areaColor: this.type === 'total' ? '#D9E3FF' : this.type === 'suspected' ? '#FDECCA' : '#FABEBE'
            },
            data: this.statistic[this.type].map(item => {
              if (this.mapName === 'china') {
                return { name: item.name.replace(/(省|市|自治区|壮族|回族|维吾尔|特别行政区)/g, ''), value: item.count }
              } else {
                return { name: item.name, value: item.count }
              }
            })
          }
        ]
      }
    },
    tbody () {
      const suspected = {}
      const confirmed = {}
      this.statistic.suspected.forEach(item => (suspected[item.name] = item.count))
      this.statistic.confirmed.forEach(item => (confirmed[item.name] = item.count))
      return this.statistic.total.map(item => [
        item.name.replace(/(自治区|壮族|回族|维吾尔|特别行政区)/g, ''),
        item.count,
        suspected[item.name] || 0,
        confirmed[item.name] || 0
      ]).sort((a, b) => b[1] - a[1])
    }
  },
  created () {
    getPositionSt().then(res => {
      const { level, provinceName } = res.data.data
      if (level === '3' && provinceName) { // 展示一个省的地图
        // 获取省的拼音名字 name = '四川' => pinyinName = 'sichuan'
        const transformedName = provinceName.replace(/(省|市|自治区|壮族|回族|维吾尔|特别行政区)/g, '')
        const pinyinNamePingYing = this.provinces[this.provincesText.indexOf(transformedName)]
        this.mapName = pinyinNamePingYing
      } else {
        this.mapName = 'china'
      }
      axios({
        url: `/ncov/static/echarts/map/json/${this.mapName}.json`,
        method: 'get',
        dataType: 'json',
        crossDomain: true,
        cache: true
      }).then(resJson => {
        this.$nextTick(() => {
          vChart.registerMap(this.mapName, resJson.data)
          this.statistic = res.data.data
        })
      }).catch(e => {
        this.$toast('地图资源加载错误')
      })
    })
  },
  methods: {
    tabClick (name, title) {
      this.onTrack('H5疫统计_疫情统计页_位置分布_切换分布', { '分布类型': title })
    }
  }
}
</script>

<style lang="scss" scoped>
.position {
  padding: 20px;
  background-color: #FFF;
}
.van-tabs ::v-deep {
  .van-tabs__wrap {
    height: 35px;
  }
  .van-tabs__nav--card {
    margin: 0;
    border: none;
    height: 35px;
  }
  .van-tab {
    color: #666;
    font-size: 12px;
    font-weight: bold;
    line-height: 35px;
    background-color: #F5F6F7;
    border-right: 2px solid #FFF;
    &.van-tab--active {
      color: #FFF;
    }
    &:nth-of-type(1).van-tab--active {
      background-color: #3F70FE;
    }
    &:nth-of-type(2).van-tab--active {
      background-color: #FEBB39;
    }
    &:nth-of-type(3).van-tab--active {
      background-color: #FE5E3F;
    }
  }
  .van-tab:first-of-type {
    border-radius: 10px 0 0 10px;
  }
  .van-tab:last-of-type {
    border-radius: 0 10px 10px 0;
  }
}
.echarts {
  width: 100%;
  height: 300px;
}
</style>vue
<template>
  <div class="box" :style="styleVar">
  </div>
</template>
<script>
export default {
  props: {
    height: {
      type: Number,
      default: 54,
    },
  },
  computed: {
    styleVar() {
      return {
        '--box-height': this.height + 'px'
      }
    }
  },
}
</script>
<style scoped>
.box {
  height: var(--box-height);
}
</style>